

You can find on this page the France population map to print and to download in PDF. The France population density map presents the number of inhabitants in relation to the country size and the structure of the population of France in Europe.
The France population density map shows the number of inhabitants in relation to France size. This demographic map of France will allow you to know demography and structure of the population of France in Europe. The France density map is downloadable in PDF, printable and free.
With an estimated population of 65.8 million people (as of 1 January 2011 as its mentioned in France population density map), France is the 21st most populous country in the world. In 2003, France natural population density growth (excluding immigration) was responsible for almost all natural population growth in the European Union. The natural growth (excess of births over deaths) rose to 302,432 in 2006, its highest since the end of the baby boom in 1973. The total fertility rate rose to 2.01 in 2010, from a nadir of 1.68 in 1994.
Since a few years, the population density growth in France has been decreasing. In 2007, the population grew by about 0.62 percent as you can see in France population density map. Ten years later, in 2017, this number only reached 0.37 percent. However, unlike the majority of European countries, France appears to have a steady fertility rate of 1.9 children per woman. This phenomenon allows France to be ranked as the most fertile country in Europe. But this cannot hide the facts that the population is getting older every year.
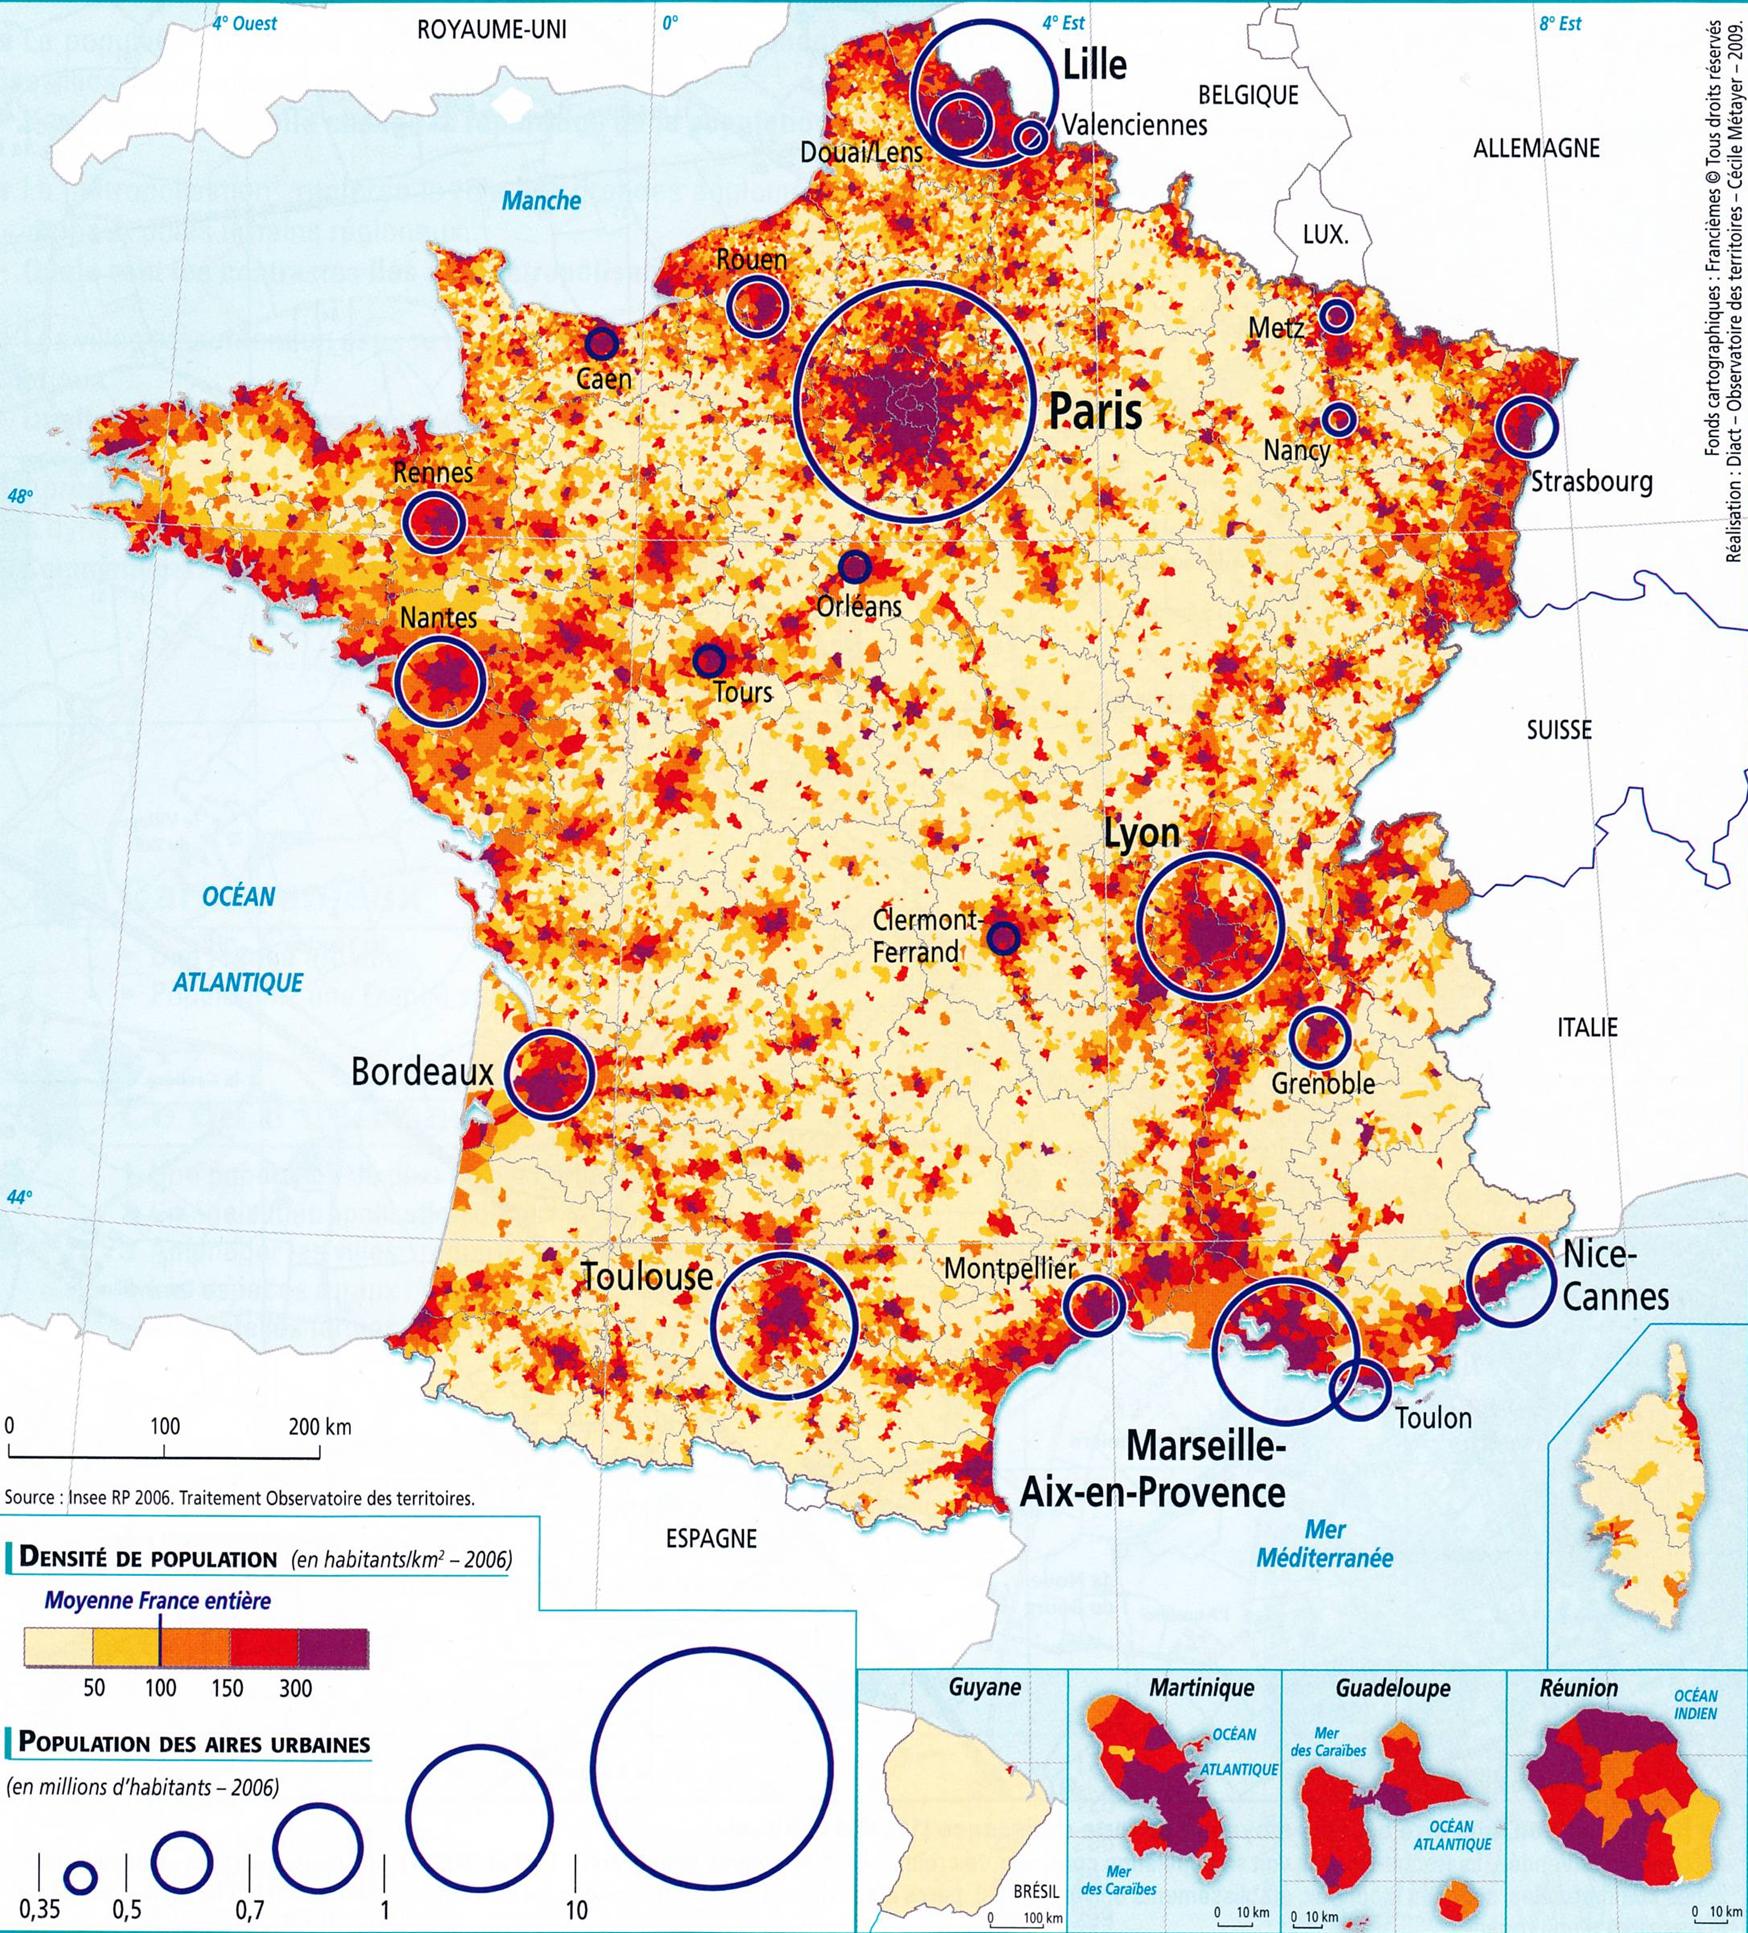
The population density in France is 119 per Km2 (309 people per mi2) as its shown in France population density map. 81.5 % of the population is urban (53,217,966 people in 2020). The population of France represents 0.95 percent of the world´s total population which arguably means that one person in every 107 people on the planet is a resident of France.